Screenshots From the README of briis/pollen_dk.
About
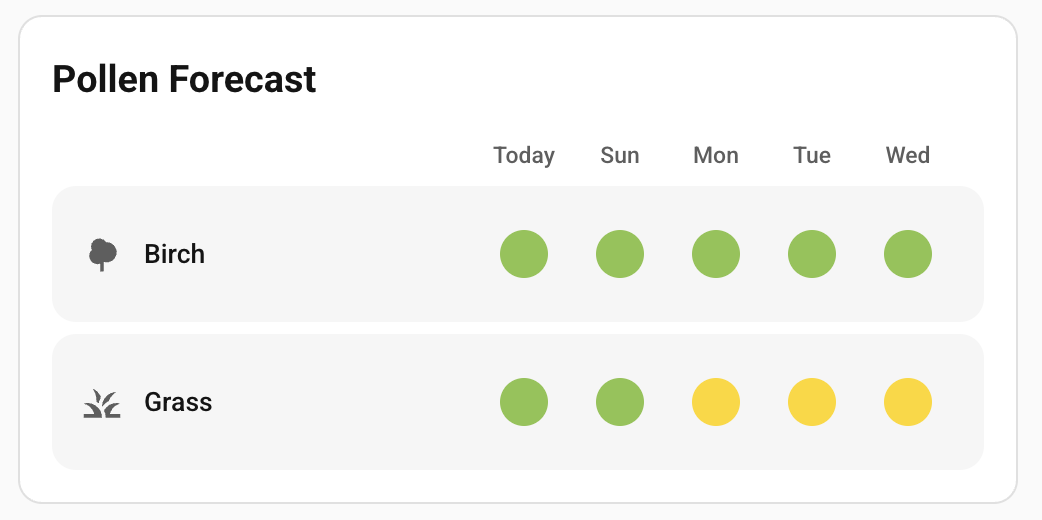
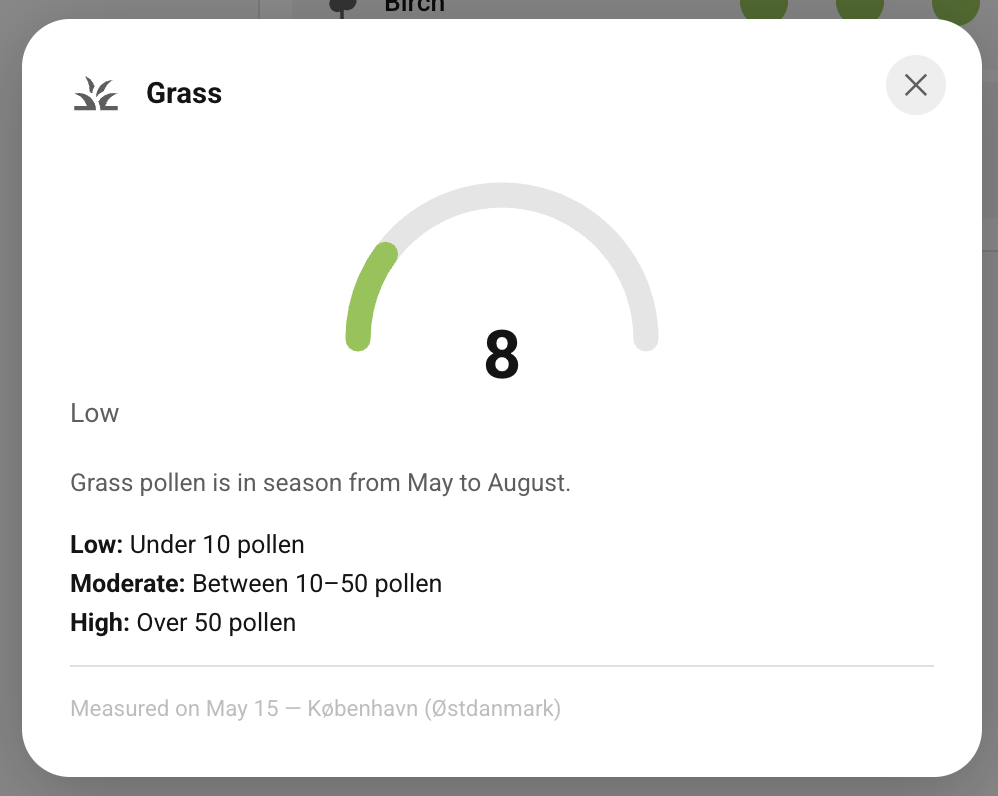
Pollen DK (Astma-Allergi Danmark) is an integration that brings live Danish pollen and spore data into Home Assistant. It reads the JSON feed of Astma-Allergi Danmark through the vendor's cloud and covers two measurement stations, København for eastern Denmark and Viborg for western Denmark. Each of the eight pollen and spore types gets a count sensor with a severity attribute, and each region also gets an overall severity sensor showing the worst level across all types. A five-day forecast is included, with daily counts per allergen and a worst-severity summary for each day. The integration also ships a custom dashboard card that shows the forecast as a grid of severity dots, with a detail popup for each row and Danish and English labels. Setup is done in the UI by choosing a region.
Automatic summary of the README and code of briis/pollen_dk. Something wrong, or are you the maintainer and want your own text here? Get in touch
Supports
Uses the vendor's cloud Needs an internet connection and an account with the vendor.
From the Marketplace Installed through the Marketplace, formerly HACS.
Actively maintained Its author released or pushed a change in the last six months.
Provides
- Sensors
Setting it up
Install it from the Marketplace and restart Home Assistant, then add it under Settings, Devices and services.
Pollen DK - Astma-Allergi Danmark
- Region
Texts from the code of briis/pollen_dk.
From the README
Home Assistant custom integration that fetches live pollen data for Denmark from Astma-Allergi Danmarks official JSON feed.
Data source: This is the same backend used by Astma-Allergi Danmarks own app and website — not a scraper.
- No scraping — uses the official JSON API endpoint
- Two measurement stations: København (Østdanmark) and Viborg (Vestdanmark)
- 8 pollen/spore types: Birk, Bynke, El, Elm, Græs, Hassel, Alternaria, Cladosporium
- Raw count sensors (pollen/m³) with severity attribute for each type
- Overall severity sensor per region (worst level across all types)
- 5-day forecast — per-allergen daily counts and worst-severity summary per day
- Custom Lovelace card — visual forecast grid with severity dots and detail popup
- UI config flow — no YAML required
- Updates every hour (data itself refreshes once daily ~16:00 CET)

Shows in Vulpo
Chart card, Apple Watch.Information
- Installs
- 77 sharing analytics
- GitHub stars
- 1
- Connection
- Uses the vendor's cloud
- Upkeep
- Updated in the last 6 months
- Version
- v1.1.5,
- Category
- Weather and alerts, Air quality and pollen
- Kind
- Marketplace integration
- Needs
- Needs the Marketplace (HACS on 2026.10 and older)
- Domain
pollen_dk- Issues
- Report an issue