mini-graph-card
kalkih
On Home Assistant 2026.11 or newer? Open it in the Marketplace
- GitHub stars
- 3.9k
- Upkeep
- Updated in the last 6 months
- Version
- v0.13.0,
- Kind
- Dashboard card
- Needs
- Needs the Marketplace (HACS on 2026.10 and older)
- Issues
- Report an issue
Independent directory, made by the developer of Vulpo. Not affiliated with Home Assistant or the Open Home Foundation.
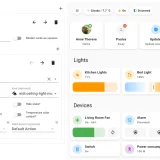
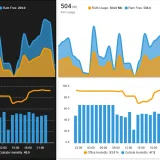
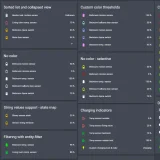
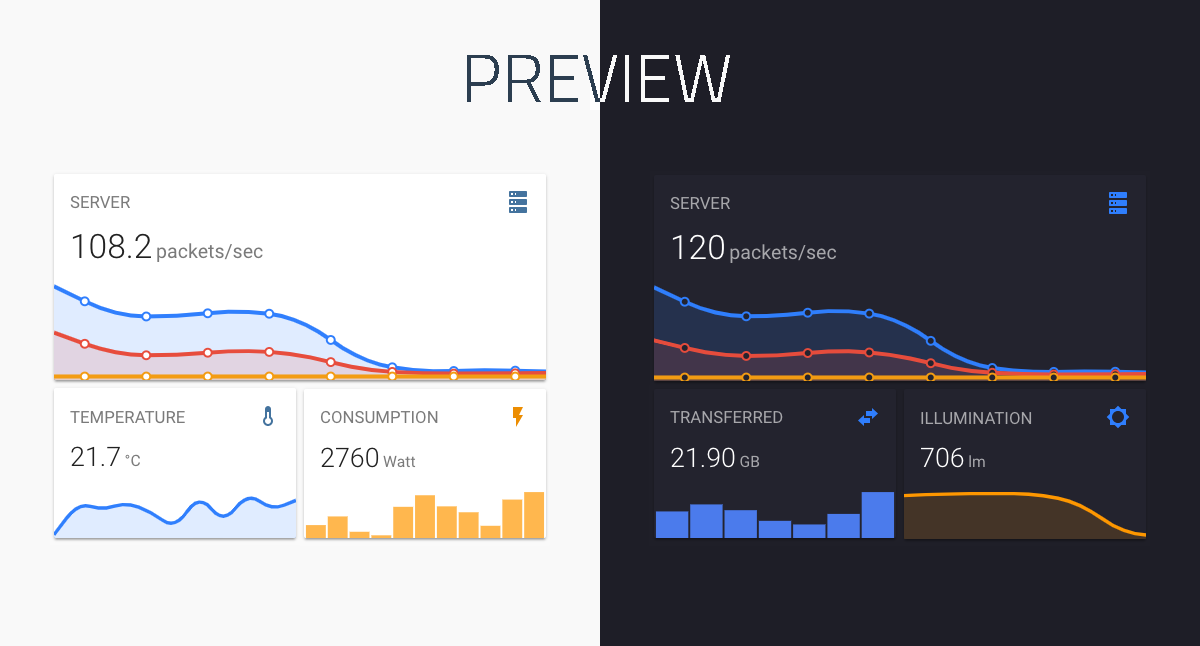
Screenshots From the README of kalkih/mini-graph-card.
About
mini-graph-card is a dashboard card that shows a sensor's current state with a line graph of its history. It works with entities from the sensor and binary sensor domains. The graph can be drawn as a line or as a bar chart, and several entities can be combined in one card. Recorded values are grouped into time buckets, and an aggregate function decides how each bucket becomes a single point or bar. The history span and the level of detail are set with options for hours to show and points per hour. Line colors can change with value thresholds, and display elements can be hidden to leave a graph-only card. It is installed through the Marketplace or by adding the bundled file manually.
Automatic summary of the README of kalkih/mini-graph-card. Something wrong, or are you the maintainer and want your own text here? Get in touch
Supports
From the Marketplace Installed through the Marketplace, formerly HACS.
Actively maintained Its author released or pushed a change in the last six months.
Setting it up
Install it from the Marketplace, then add a card of this type to a dashboard.
From the README
A minimalistic and customizable graph card for Home Assistant Lovelace UI.
The card works with entities from within the sensor & binary_sensor domain and displays the sensors current state as well as a line graph representation of the history.
Information
- GitHub stars
- 3.9k
- Upkeep
- Updated in the last 6 months
- Version
- v0.13.0,
- Kind
- Dashboard card
- Needs
- Needs the Marketplace (HACS on 2026.10 and older)
- Issues
- Report an issue